Coordinate Graphing Mystery Pictures: Make Your Own on a Four-Quadrant Grid
A mystery picture is a list of ordered pairs and nothing else. Plot each pair, join them in the order they are written, and a shape appears that was never described in words. It is plotting practice that checks itself: a point in the wrong place is visibly in the wrong place, and the student fixes it without being told. The problem is supply. A downloaded set comes with whatever picture somebody else drew, on whatever grid their page happened to use, and the moment you want a different subject, a range that fits the paper you have, or a version for the student who is still working in one quadrant, you are better off making your own. That turns out to be the easier half. This article covers printing the grid, ruling and numbering the axes (the generator prints squares, not axes), designing the picture backward by drawing it first and reading the coordinates off afterward, writing the list so the pencil lifts in the right places, which shapes can land on grid intersections and which cannot, and how to pitch the same picture up or down a grade.
How a Mystery Picture Works
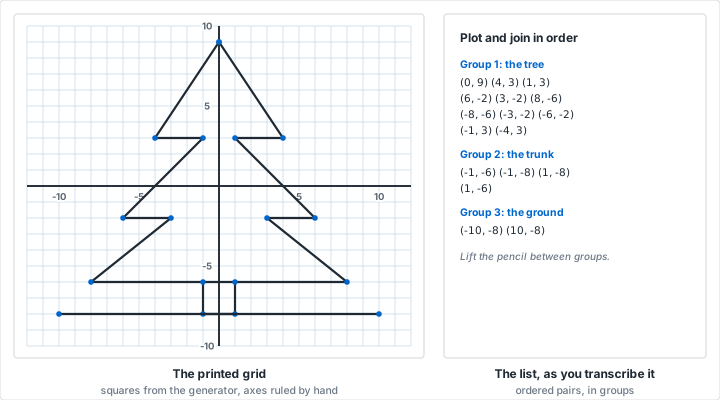
The whole activity is three rules. Plot the first pair. Join it to the second with a straight line. Keep going to the end of the group, then lift the pencil and start the next. Nothing else is explained, and that is the design: a student has no idea whether a point is right until the shape starts to look like something, which turns a worksheet of forty plots into forty self-checking ones.
It also means the picture is a chain of straight lines between whole-number coordinates, so the subject has to survive being reduced to one. A fir tree does. A sleeping cat does not, at least not without more points than anyone will plot.
Four quadrants are what make it worth the time. In the first quadrant alone every number is positive, and a student can finish the sheet without once thinking about sign. Spanning all four forces a decision about direction at every point, and a sign error shows up as a visible dent rather than as a quietly wrong answer. If the class is still learning the coordinate plane, that tutorial covers the mechanics this activity then exercises.
Print the Grid
Two settings do the work: the standard square grid style, and a square large enough to plot in without a magnifier. Everything else is paper and margins.
The Size of a Square
A quarter inch square is the standard classroom ruling and the right default here. On Letter with the generator's half inch margins it gives 30 squares across and 40 down, which the grid details line under the preview confirms as you change the settings. That is a working range of x from -15 to 15 and y from -20 to 20, more than any hand-plotted picture needs. On A4 with 10 mm margins, 5 mm squares give 38 across and 55 down.
Go bigger for younger students or for anyone plotting with a marker: half inch squares on Letter give 15 across and 20 down, so ignoring one column leaves a range of -7 to 7 by -10 to 10. Go smaller only if the picture genuinely needs it, because a point on an eighth inch grid is hard to see and harder to correct.
Why an Even Number of Squares Matters
This is the setting people get wrong. The axes lie along printed grid lines, and for both to sit in the middle of the sheet you need an even number of squares in each direction. Thirty across means 31 vertical lines, and the sixteenth has exactly 15 on either side of it: that is your y-axis. An odd count gives a middle column of squares instead of a middle line, and the axis ends up shoved one line over.
To set the count rather than the size, switch Grid Mode to Specify Square Count, set Count Direction to Squares Across, and type the number. The generator divides the printable width by it, reports the square size it worked out, and fills the height with as many whole squares as fit. When one direction still comes out odd, leave the outermost row or column unused and rule the axis through the middle of what is left: the spare strip is somewhere to write a name.
Line Weight and Color
Set the line weight to Light and the line color to gray. The grid is scaffolding, not the drawing: a pale square lets the inked axes read as axes and a pencil line read as the picture, where a medium blue grid competes with both. The same reasoning drives the pale grids in our ink drawing challenge article. Print at 100 percent with page scaling off, or the squares will not measure what you asked for and a second printing will not match the first; the printing tips guide has the settings for each browser.
Rule and Number the Axes
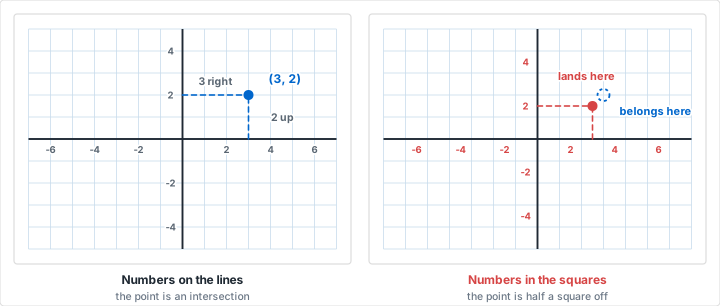
The generator prints a grid. It does not print axes, numbers or an origin, and no setting adds them: cell numbering exists only for the hexagonal style. So the axes are yours to rule, which takes about a minute and is the step that turns graph paper into a coordinate grid.
Find the middle vertical line by counting in from both edges and go over it with a pen and a straightedge, then do the same for the middle horizontal line. A clear ruler beats a wooden one here, because the grid line stays visible underneath it. Arrowheads at all four ends are worth adding: they are the reminder that the plane carries on past the paper.
Then number, at the lines rather than inside the squares, and just outside the axis so the numbers do not sit where a point will go. Every line on a 30 by 40 grid is 70 small numbers and a lot of clutter, so number every fifth line and let the student count the rest. If you would rather have the counting by fives done in print, use engineering graph paper, whose heavier line every five squares gives the same landmarks; the axes still need ruling.
Label the axes x and y, mark the origin 0, and for a class new to negatives write the quadrant numbers in their corners, I at the top right and counting counterclockwise. Photocopy the sheet once the axes are on it, so a disagreement about the picture can never be a disagreement about the paper.
Design the Picture Backward
Nobody designs a mystery picture by writing coordinates. You draw the picture on the ruled grid first, in pencil, and read the pairs off it afterward. The list is a transcription, not a composition.
Draw with the grid, not over it: every corner goes on an intersection and every line runs from one intersection to another. Sketching a smooth outline and then nudging its corners onto the nearest crossings produces a lumpier picture than drawing to the grid did. The habit is the one our article on pixel art on graph paper describes, where the grid is the medium rather than a guide, and the one behind a cross-stitch chart, where a curve exists only as the cells it passes through.
Keep the point count honest. Thirty to fifty points is a 20 minute activity for most middle school classes, and 80 points is a lesson that nobody finishes. If the drawing needs more than that, simplify the subject rather than shrinking the squares. When the shape is settled, go over it in pen and erase the pencil: that sheet is your answer key, and comparing a student's picture against it beats checking 40 pairs one at a time.
Writing the Coordinate List
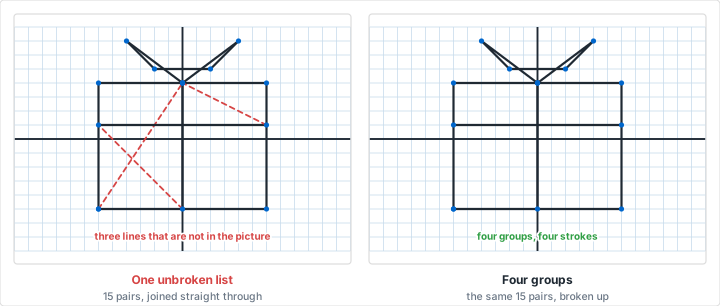
Now read the drawing. Start at a corner, write its pair, and walk the outline in one direction, writing each corner as you reach it. Close a shape by repeating its first pair at the end, so the last point joins back to the first rather than being guessed at.
A picture is almost never one stroke, and this is where most homemade sheets fail. The moment the pencil has to leave the paper the list has to say so, and the only way to say it is to break the list into numbered groups with a blank line between them, under an instruction at the top of the sheet: join the points of each group as you go, then lift your pencil and start the next. Without that break the reader joins the end of one stroke to the start of the next and rules a line across the picture.
Two conventions are worth adopting. Write the groups in drawing order, outer shape first, so a student who runs out of time still has something recognizable. And never name a group after what it draws, however tempting: "Group 2: the trunk" gives away the one thing a mystery picture has to withhold. Label the groups on your own copy and number them on theirs.
Then check the list by plotting it yourself on a fresh sheet without looking at the drawing. Five minutes, and it catches the transposed pair, the sign dropped off a negative and the group boundary in the wrong place, each of which is invisible on the list and obvious on the plot.
Points That Land on Intersections
A square grid will hold some shapes exactly and no others, and knowing which is which saves a lot of erasing.
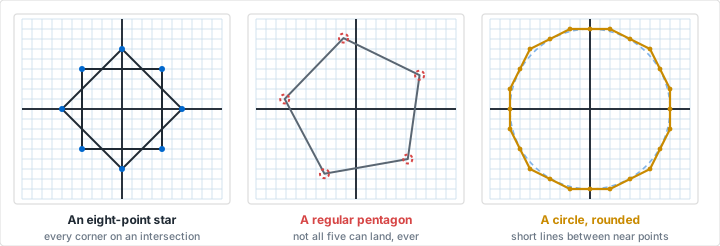
Anything built from horizontal, vertical and 45 degree lines lands perfectly, because those are the directions the grid runs in. So does any other whole-number slope: two across and three up is as exact as one and one, which is how you get a tree tier or a roof pitch that is not 45 degrees. An eight-pointed star made from a diamond and a square laid over each other is all whole-number corners and reads as far more complicated than it is.
What cannot land is more interesting. Of all the regular polygons, only the square can have every corner on a grid intersection, at any size and any rotation. An equilateral triangle, a regular pentagon and a regular hexagon never can, which puts a five-pointed star and a true six-sided snowflake out of reach on square paper. That is a property of the grid, not a limit of your drawing. For a six-fold design, print polar graph paper and work in rings and radials, where the equal angles are given to you, or use hexagonal graph paper where the hexagon is the cell.
Curves are a middle case: round each point to the nearest intersection and draw short straight lines between them, exactly as a plotter would. Stepping a circle of radius 8 round in 15 degree increments gives 24 corners, every one a whole-number pair, and the ring reads as a circle at arm's length and as a polygon up close. Spend points where the curve turns hardest and save them along the straighter parts.
Holiday Pictures That Grid Well
These sheets get used most in November and December, and the seasonal subjects that work are the ones made of straight edges and symmetry.
- A fir tree. Tiers of zigzag down to a rectangular trunk, with a ground line underneath. Around 20 points, symmetric, and forgiving: a tier one square wide of where you meant it still looks like a tree.
- A wrapped gift. A rectangle, two ribbons crossing it and a bow of five straight lines. Fifteen points, and a good first design because the four groups teach the pencil-lifting rule on a picture that cannot hide the mistake.
- A candle and flame. A tall rectangle, a wick of two points, a flame as a narrow diamond. Simple enough for a single-quadrant version.
- A dreidel. A square body, a triangle below it and a short handle above, which is a natural second group.
- A menorah. A base, a stem and branches of equal height stepped out either side, almost all vertical and horizontal lines.
- An eight-point star. The diamond and square overlay from the figure above: 8 points to plot, and the only shape here that would be genuinely hard to draw freehand.
Keep brand characters and licensed figures out of it. A shape you drew is yours to photocopy and a licensed character traced onto a grid is not, and the generic subjects above are the ones that survive being reduced to 30 points anyway.
Symmetry Cuts the Work in Half
Most seasonal subjects are symmetric about a vertical line, and the four-quadrant grid turns that into real savings. Put the line of symmetry on the y-axis, draw and transcribe the right-hand half only, then produce the left half by negating every x and reading the list back up from the bottom.
The tree in the figure above is exactly that. Its right half runs (0, 9), (4, 3), (1, 3), (6, -2), (3, -2), (8, -6). Negate each x and reverse the order and you get (-8, -6), (-3, -2), (-6, -2), (-1, 3), (-4, 3), (0, 9), which completes the outline and closes it at the apex. Half the drafting, and no chance of the two sides disagreeing.
That arithmetic is also the extension activity. Give the class the right half and ask them to work out the left, and the picture becomes a lesson in reflection: reflecting in the y-axis negates x, reflecting in the x-axis negates y, a half turn about the origin negates both, and a quarter turn counterclockwise sends (x, y) to (-y, x). Each one produces a picture they can check by looking at it. The visual math activities post has the companion exercises for tessellations and spirals.
Running It With a Class
Print two things: the ruled and numbered grid, and a one-page handout with the groups of pairs and the three rules at the top. Keeping them separate means a student who makes a mess of the grid gets a fresh one without a second copy of the list, and the same list can run at two grid sizes in one room.
Pitch it by changing the range rather than the picture. For a first-quadrant class, add 8 to every x and 10 to every y so the whole picture sits in positive numbers, and rule the axes along the bottom and left edges instead of the middle. For the group that finishes early, hand out the half-picture version from the symmetry section, or ask them to design one for a partner, which is where the real learning is: reading coordinates off a drawing is harder than plotting them onto one.
Have them color the finished picture: two minutes, it makes the shape unambiguous, and it gives you something for the wall. For more self-checking grid work, the grid puzzles article covers nonograms, which hide a picture behind arithmetic rather than behind coordinates, and seating charts is the other classroom sheet this generator gets printed for most.
Choosing Your Settings
| Who is plotting | Square size and paper | Range to design in |
|---|---|---|
| Early grades, one quadrant | 1/2 in on Letter | 0 to 15 by 0 to 20 |
| Early grades, four quadrants | 1/2 in on Letter | -7 to 7 by -10 to 10 |
| Middle grades, four quadrants | 1/4 in on Letter | -15 to 15 by -20 to 20 |
| Middle grades, metric paper | 5 mm on A4, 10 mm margins | -19 to 19 by -27 to 27 |
| A detailed picture | 1/4 in on Tabloid | -20 to 20 by -32 to 32 |
| Counting by fives in print | Engineering, heavy every 5 | whatever the sheet gives |
| A six-fold or radial design | Polar, 12 or 24 radials | rings and angles, not pairs |
Those ranges are what the sheet holds, not what the picture should fill. Leave two or three squares of air on every side, so the numbers have somewhere to live and a point plotted one square wide of the mark still lands on paper.
Mistakes That Break a Mystery Picture
Mistake: Numbering the Squares
Problem: The axis numbers get written inside the squares, the way the days of a calendar are. Every point then lands in the middle of a cell rather than on an intersection, and two students who read the numbering differently produce pictures that will not overlay.
Solution: Numbers go at the lines, outside the axis. Say it out loud the first time: a coordinate is a crossing, not a box.
Mistake: One Unbroken List
Problem: The list runs from the first point to the last with no breaks, so the reader joins the end of one stroke to the start of the next and rules a line through the picture. On a four-group drawing that is three stray lines, and no amount of correct plotting hides them.
Solution: One group per stroke, numbered, with a blank line between them and the lift-your-pencil rule printed at the top of the handout.
Mistake: An Odd Number of Squares
Problem: The grid comes out 31 squares across, so there is no middle line. The y-axis ends up one line over, the ranges either side of it do not match, and a picture designed symmetrically comes out lopsided.
Solution: Choose a square size and margins that give an even count in both directions, or set the count directly in Specify Square Count mode. Check the grid details line under the preview before printing.
Mistake: Points Between Intersections
Problem: The design was sketched freehand, so its corners fall between crossings and the coordinates come out as halves and quarters. Students plot those inconsistently, and a five-pointed star never resolves however carefully it is drawn.
Solution: Draw corner to corner on the grid from the start. Keep every pair a whole number, approximate curves as short straight lines between the nearest intersections, and move a radial or six-fold design to polar paper where it belongs.
Conclusion
A mystery picture is cheap to make and unusually good at what it does, because the feedback is the picture itself. Everything that makes one work happens before a student plots anything: an even count of squares so the axes sit on real lines, numbers written at the lines, corners drawn on intersections, and a list broken into one group per stroke.
Print the grid, rule the axes, draw the thing you want on it, and read the pairs off the drawing. Half an hour gives you a sheet you own, at a grid size your class can actually plot on, with a subject that fits the week you are teaching it in.
Print a Four-Quadrant Grid
Quarter inch squares on Letter, 30 across and 40 down, so the middle lines become your x and y axes. Free, with no account and nothing to install.
Create Your Coordinate GridRelated Resources
- Math Graphing Tutorial: axis setup, scale choice and plotting functions on the same grid
- Visual Math Activities on Graph Paper: ten more classroom activities that run on a printed grid
- Creating Pixel Art on Graph Paper: designing with the grid rather than over it
- Cross-Stitch and Knitting Patterns: the same counted grid read as a chart
- The Grid Method for Drawing: scaling a design up square by square
- Polar Graph Paper: the sheet for six-fold snowflakes and radial designs
- Designing and Solving Grid Puzzles: more self-checking grid work for a class
- Pumpkin Carving Patterns on Graph Paper: another seasonal design drawn square by square